3 Examples for evaluation
Sometimes you draw up a scheme (plan) for finding a way. You draw it in the sand or on a piece of paper—however, it will only be a graphic drawing (Example 1).
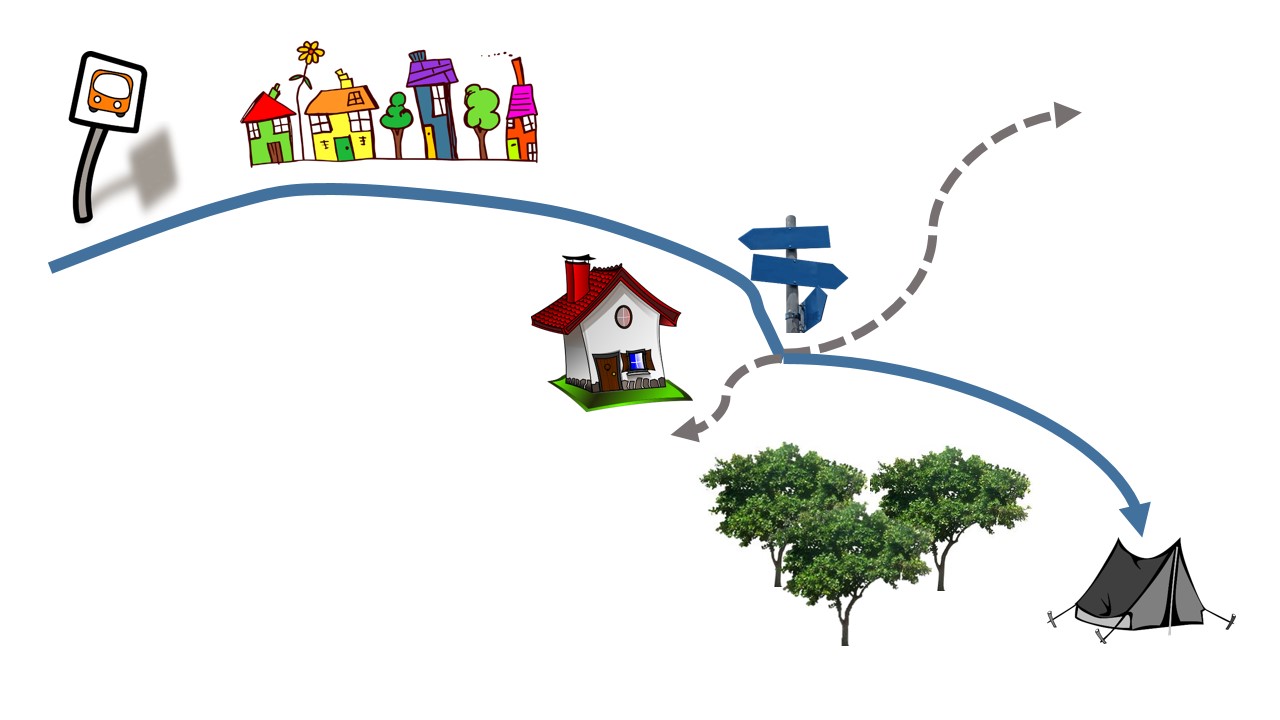
For example, you want to show how to find a way to a summer camp, in a presentation. Maps are one of the most popular subjects of visual information, which are often also featured in teaching aids.
Example 1. Graphic—road signs
During the presentation, you can add a drawing with your explanation in text boxes and create animations (Example 2).
However, the recent online slide is still just graphics. Although animation helps to capture the content, it does not have a voice, which might help to perceive the information.
Example 2. A graphic—road signs with animation and text boxes.
So, for a presentation that we publish on-line—that is, we give it an independent life—a precise storytelling is needed to make the audience to perceive the information better. With a narrated record, we wrap our presentation so that the recipient receives the message contained in the material more fully (Example 3).
Example 3. Narrated presentation—graphic, text boxes, narration
What other aspects are involved in creating these two presentations?
1. We can add an additional text to the graph of Example 2, thus increasing the load of the slide. Still, this information will only be perceived with sight.
2. In Example 3, by adding a narrative, the perception of the audience will be more accurate with audio information.
3. Of course, simple information such as contained in this easy scheme could also be presented very simply, leaving the whole load to the drawing.